What is 鳴子 NARUKO?
Reduce expenses and operational overheads of monitoring AWS

"鳴子 - NARUKO -" is an AWS management automation tool created through the accomplishment of numerous cloud services and projects.
Monitoring automation allows for a hands-down management of your AWS environment.
Naruko was developed as an OSS to help those who have motives such as wanting to reduce the burden of managing, planning to cut down on excessive costs, and those who are willing to use AWS to its full potential.
We hope that Naruko would help as many people as possible who have such motives.
Naruko is a tool that produces sound to drive birds away, in order to protect grain from getting damaged.
Which is where we got our name from, Naruko, a tool to protect your AWS environment from failures and alert you as quick as possible.
Features
Instantaneous failure detection, and swift recovery

System failure notification
Instant notification though e-mail when usage exceeds specified threshold.

Stopping and starting EC2 instances
When a failure is detected, the stopping/starting instances can be done automatically.

Backup AWS environment
Automating backup schedules.

Automatic call upon system failure
Phone calls through Amazon Connect when system failure occurs.
regular functions
System monitoring
Scheduled backup,
Stop/Start monitoring,
Start/stop/restarting EC2 instances
In case of failure
Alert notification
・E-mail notification
During failure
Disaster recovery support
・EC2 stopping/starting instances
Watch items
Bulk management of multiple services
| AWS service | Monitor item name | AWS metrics |
|---|---|---|
| Vital monitoring | 「StatusCheckFailed」 | |
| CPU utilization | 「CPUUtilization」 | |
| Disk reading amount | 「DiskReadBytes」 | |
| Disk write amount | 「DiskWriteBytes」 | |
| Network traffic received | 「NetworkIn」 | |
| Network traffic transmitted | 「NetWorkOut」 | |
| CPU utilization | 「CPUUtilization」 | |
| Free memory | 「FreeableMemory」 | |
| Number of disk reads | 「ReadIOPS」 | |
| Number of disk writes | 「WriteIOPS」 | |
| Read throughput | 「NetworkReceiveThroughput」 | |
| Write throughput | 「NetworkTransmitThroughput」 | |
| Number of DB connections | 「DatabaseConnections」 | |
| Replica delay time | 「ReplicaLag」 | |
| Latency | 「Latency」 | |
| Request count | 「RequestCount」 | |
| Healthy EC2 instances | 「HealthyHostCount」 | |
| Unhealthy EC2 instances | 「UnHealthyHostCount」 | |
| HTTP response code(4xx) | 「HTTPCode_ELB_4XX」 | |
| HTTP response code(5xx) | 「HTTPCode_ELB_5XX」 |
To monitor other services or custom metrics Naruko will need to be customized.
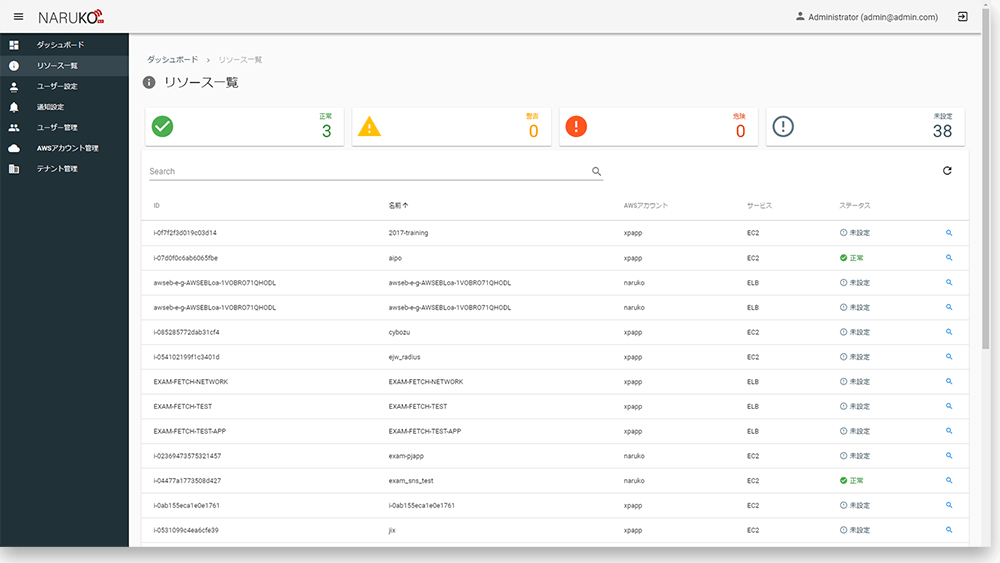
Management screen
Clean and Simple UI

1、Visually easy to recognize multiple metrics, allowing to recognize failures immediately.
2、An intuitive interface, no specialized knowledge is needed for operation.
3、Multi-account/Multi-region management possible as well.
In addition to your own account, you can register multiple environments from other accounts/services and manage them centrally. Unified management of multiple AWS regions*
※Regions to support (US East (N. Virginia), US East (Ohio), US West (N. California), US West (Oregon), Canada (Central), Europe (Frankfurt), Europe (Ireland), Europe (London) EU (Paris), Asia Pacific (Tokyo), Asia Pacific (Seoul), Asia Pacific (Singapore), Asia Pacific (Sydney), Asia Pacific (Mumbai), South America (Sao Paulo)

AWS Consulting Prtner
Cross power is certified as an AWS consulting partner.


